Managing multiple teams requires a lot of careful prioritising and planning. Not all projects that you and your colleagues are working on will be the same. Some require more resources. Others have more tasks. Some tasks may take longer than others.
It’s like juggling multiple balls, all of which have different weights.
That’s why you might find the monday.com dashboard quite useful. Instead of deep-diving into the individual projects, you can get all the salient information from the dashboard.
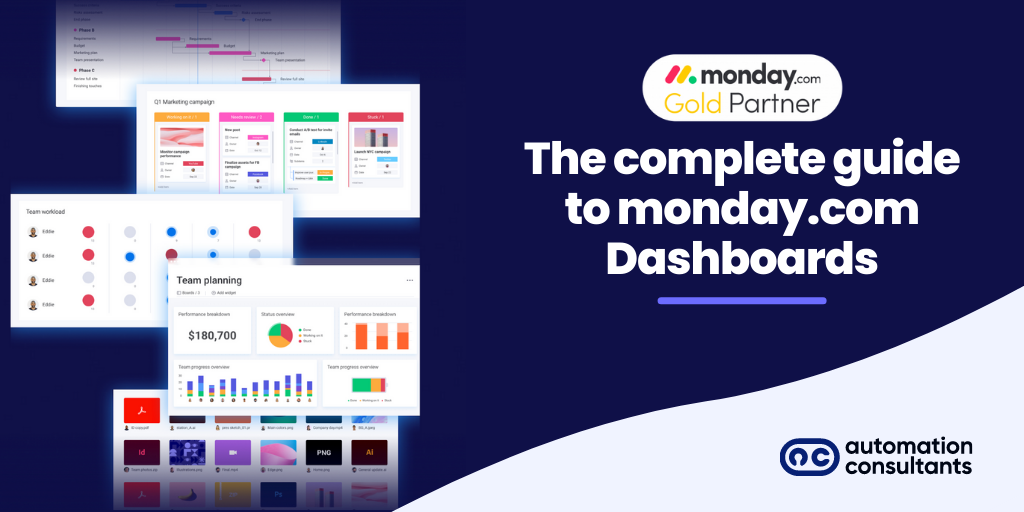
Whether it is KPIs, budget tracking, tasks, timelines, deadlines, or team workloads, monday.com dashboards give you a bird’s-eye view of everything you’re managing, along with some other helpful features.
So, what is a monday.com dashboard?
The monday.com dashboard is a space where you can see an overview of important updates, notifications, and project timelines. It is customisable, so you can configure it according to your needs.
Plus, it offers various tools, like scheduling email notifications, email pulses, filters, time tracking, and “I was mentioned” widgets to make your work easier.
Why do you need the monday.com dashboard?
As we said earlier, project management involves juggling multiple projects at the same time. Here’s how the monday.com dashboard can make that “juggle” easier for you.
All the important information, at a glance
As project manager, you have to plan tasks along with your operational strategy. At the same time, you also have to optimise your team and their workload.
With the monday.com dashboard, you can track the information that’s important to you. Get a snapshot of your pipeline, task statuses, team workloads, Gantt charts, calendars, and much more.
Accessible anywhere, anytime
The monday.com dashboard, as well as the entire OS, is cloud-based. That means you can view your project plans from anywhere on any device. Are you on the go and need to quickly check the status of your projects? Going to a meeting and need a quick refresher? Everything you’re looking for is visible from the dashboard.
Collaboration-friendly
Your monday.com dashboard can be used to share the status of projects, manage the prioritising and assigning of tasks, and keep the team in sync.
How do you set up a dashboard on monday.com?
Setting up a dashboard on monday.com is quite simple:
- Go to the workspace for which you’d like a dashboard and click the +Add icon. A popup menu will appear with a list of items you can add. Click on “New Blank Dashboard”.
Another way of doing it is directly from your preferred folder. Next to the folder’s name, you’ll see three dots. Click on these, and you’ll see the option to “Create dashboard in folder”. - Once you’ve created a new dashboard, you can give it a name. You also get the option of making it private or public.
A public dashboard will be visible to everyone on your account, whilst a private one will only be visible to you and any team members you invite. - Once you’ve set up access, it’s time to select your dashboard’s boards. To make this easier for you, monday.com offers a list of the recent boards you’ve interacted with. You can also search for the board you want by name in the search bar.
(Just bear in mind that the number of boards you can add to a dashboard depends on your plan.) - The next step, after you’ve added the boards, is to select the widgets that you’d like to display.

Need extra monday.com training?
We can help.What can you do with your monday.com dashboard?
Once you’ve created your dashboard, you can print it, export it as a PDF (certain widgets can be exported as Excel sheets as well), edit, and view filtered information. But, you can also use it for:
- Tracking projects
- Viewing upcoming tasks
- Reviewing metrics and analytics
- Scheduling email notifications
- Sending emails by integrating email client (and sending updates via emails to pulses)
- Sharing information
- Filtering information

What widgets can you use to visualise your projects?
Widgets are commonly used to give you a sense of the status of your projects.
Here are some of the most useful widgets:
Team workload
The workload widget gives you a graphical view of the division of your team’s work. It also provides a centralised view of the timelines for all their tasks. The best part? It can draw information from multiple boards to help you get a complete picture.
Chart view
The chart view helps you gather the analytics data and convert it into an easy-to-understand visual representation—graphs, bar charts, pie charts, etc. Again, this information can be pulled from various boards.
Timeline widget
Do you need to see timelines from different projects in one place? The timeline widget allows you to do exactly that. This is a great tool for when you need to see how tasks need to be prioritised and if there are any looming deadlines.
Gantt widget
The Gantt widget provides you with a visual representation of all your projects and their pipelines. It lists the tasks and their due dates on one side and displays a graphical representation of each item as an item bar, complete with connecting dependency lines.
Calendar widget
Another great widget that helps you view information from multiple sources, the calendar gives you a top-level view of everything that’s happening within the specified boards.
Battery widget
If you’re not interested in the really granular stuff, but would like a way of monitoring the overall progress of your projects, try the battery widget. It displays the project status in the form of a battery, where coloured bands show what percentage of the project is completed, in progress, on hold, not started, etc.
Number widget
Do you want to view numerical data in one place? This widget can help you track where the project stands in terms of numbers.
Table widget
Sometimes, the information you need can’t be properly put into context without other information around it. In this case, the table widget might be what you need. Pulling data from across boards, this widget displays the information in rows and columns.
Countdown widget
Are you waiting for an important project deadline, event, or product launch? Yes, you can mark it on your calendar, but a ticking timer adds that extra sense of urgency (and sometimes fun).
"I was mentioned" widget
You can go through your notifications to see if someone tagged you in a comment or task. Or, you could use the “I was mentioned” widget to collate any notifications meant for you. What’s more, it’s customisable so you can decide which notifications you want to see.
Time tracking
Part of project management is monitoring how long tasks take to complete, or how long individual team members take to complete a task. Whether you need to calculate billable hours or see if the workload is spread fairly, the time tracking widget will give you this information in an easily viewable format.
To-do list
No one can remember everything they have to do in their heads. That’s why we have to-do lists. And, that’s exactly what this widget is for.
Fun widgets
Work doesn’t have to be boring; you can have a good time while you meet deadlines and complete projects. Your monday.com dashboard helps you enjoy the hard data with some “fun” widgets.
If you need a little inspiration, try the “quote of the day” widget. If your eyes are burning from scanning too many spreadsheets, try the llama farm widget, which gives you the task distribution in the form of colourful llamas. You can even play music or videos directly from your dashboard with the playlist and YouTube widgets.
Marketing & sales widgets
Whilst there are other widgets, the ones listed above are enough to provide you with the dashboard you need. But if, for example, you want a dashboard that tracks your marketing KPIs, you’d need:
- Chart widget
- Battery widget
- Board update widget (a widget that allows team members to post comments and updates)
Similarly, for measuring sales, you might want to add the Numbers and Charts widgets to your dashboard. Of course, feel free to customise your dashboard with whatever’s important to you.
What are monday.com dashboard templates?
The monday.com dashboard templates simplify your dashboard planning. If it’s your first time creating a dashboard, you’ll be tempted to try everything from the virtual smorgasbord of widgets.
But, not all of them will be useful.
Using a pre-planned template will help you get more from your monday.com reports. The best part is, you have a project management template waiting for you—you just need to populate it through your own boards or other integrated platforms.
And, if you’re not confident about handling your integration (or any other part of setting up monday.com), we’d be happy to help. As strategic monday.com partners, we can help you with everything from licensing to setup to training.
Further reading on this topic: monday Marketer – 10 Must-Have Marketing Management Features
Book a free 30-minute consultation and an expert will help you with everything you need.
Whether you need project management consulting, process assistance, or help with workflow automation and app integration, we’re here to help you with your monday.com consultancy needs.
Just drop us a note below and one of our experts will get back to you shortly.


